
When you hear the term technical analysis of stocks, you might picture a day trader glued to a screen of flashing charts. But for serious investors, it's much less about frantic trades and much more about understanding market psychology and managing risk effectively.
At its core, technical analysis is a method for studying investment trends by looking at past market data, primarily price and volume. The central idea is that all publicly known information about a company—from its earnings reports to the latest industry news—is already baked into its stock price. So, instead of asking why a stock is moving, technical analysts focus on what it's actually doing, making it a crucial component of a comprehensive stock market analysis.
What Is Technical Analysis in Wealth Management?
Think of a stock chart like a patient's EKG. The squiggly lines—the price movements and trading volumes—are its vital signs. They don't predict the future with 100% certainty, but they give you a clear reading of the market's current health and underlying sentiment.
For a high-net-worth investor, this isn't some speculative guessing game. It's a structured discipline. When you pair it with solid fundamental research, technical analysis becomes a powerful framework for making smarter decisions about when to buy, when to sell, and when to sit on the sidelines. It provides a data-driven lens to spot trends, pinpoint strategic entry or exit points, and ultimately, protect a substantial portfolio.
The Three Core Principles
Every chart you'll ever look at is viewed through the lens of three foundational beliefs. Getting these down is the first real step to using this tool effectively.
- The Market Discounts Everything. This is the big one. It's the idea that any relevant information—a great earnings report, a new competitor, a shift in interest rates—is already reflected in a stock's price. The chart, in essence, tells the whole story of supply and demand.
- Prices Move in Trends. Stocks don't just move randomly; they tend to follow discernible trends, whether they're heading up, down, or sideways. The primary job of the technical analyst is to identify these trends early and ride them.
- History Tends to Repeat Itself. Human behavior is surprisingly consistent, especially when it comes to fear and greed. Because of this, certain chart patterns that have appeared in the past tend to show up again and again, giving us clues about what might happen next.
By focusing purely on price action, technical analysis strips away the emotional noise and narrative clutter that so often lead to bad investment decisions. It answers the critical question of when to act.
This makes it the perfect partner to fundamental analysis, which tells you what to buy. When you combine the "what" with the "when," you're building a far more disciplined and resilient investment strategy. Throughout this guide, we'll dig into exactly how to apply these concepts to protect and grow your wealth.
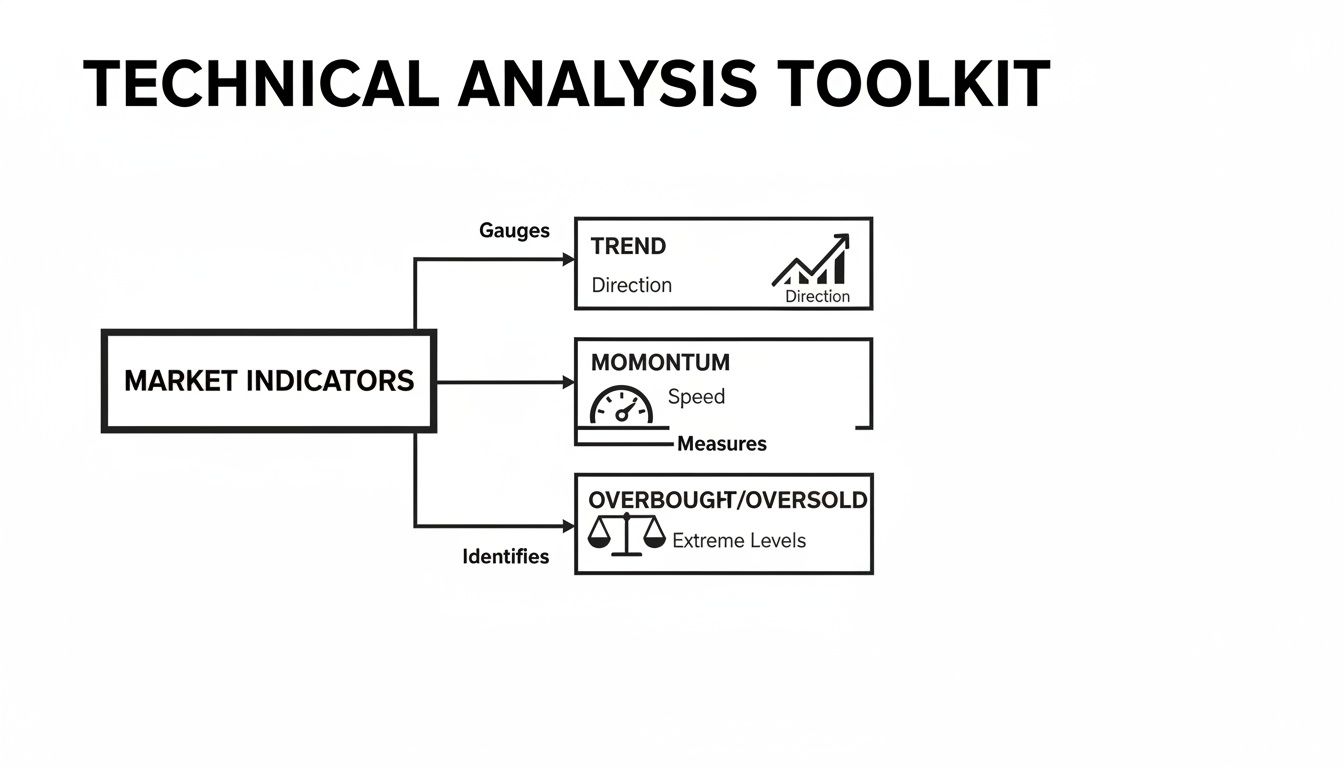
Your Essential Technical Analysis Toolkit
Jumping into the technical analysis of stocks isn’t about just glancing at a price chart. It’s about building a curated toolkit to interpret market psychology and spot high-probability setups. Forget cluttering your screen with dozens of indicators; a focused approach brings far more clarity. For wealth managers and serious investors, mastering a few key instruments is the real path to confident, repeatable decisions.
It all starts with the chart itself. A simple line chart is fine, but a candlestick chart tells a much richer story. Each "candle" is a snapshot of the battle between buyers and sellers over a set period, showing you the open, high, low, and close prices in a single, intuitive shape. This visual detail is a game-changer for gauging market sentiment at a glance. For a deeper dive into the nuts and bolts, our guide on how to read stock charts is a great place to start.
Identifying the Trend with Moving Averages
Once you can read the chart, the next job is to figure out the underlying trend. This is where moving averages come in—they are the cornerstone of trend analysis. By smoothing out the daily price noise, they reveal the bigger picture. They’re simple to understand yet incredibly powerful.
Two of the most important ones you'll see are:
- The 50-Day Simple Moving Average (SMA): Think of this as the key indicator for the intermediate-term trend. A stock trading above its 50-day SMA is generally considered healthy.
- The 200-Day Simple Moving Average (SMA): This is the definitive line in the sand for the long-term trend. Institutional investors watch this level like a hawk, and a break below it often signals a major shift in market sentiment.
These aren’t just arbitrary lines on a screen. Technical analysis is now a mainstream part of global equity trading, and a vast body of statistical research backs many common indicators. Modern platforms might offer over 120 technical studies, but the 50-day and 200-day SMAs remain absolute staples.
When a major index like the S&P 500 decisively breaks its 200-day SMA, big asset allocators often take it as a trigger to de-risk, influencing billions in capital flows. While these tools don't change a stock's fundamental value, they absolutely shape the path of returns by informing when to get in, when to get out, and how much to risk.
Gauging Momentum and Market Extremes
Knowing the trend's direction is one thing, but understanding its strength—or weakness—is what gives you a real edge. This is the job of momentum oscillators. They help answer critical questions like, "Is this uptrend getting tired?" or "Is this sell-off overdone?"
Momentum indicators are like a speedometer for a stock's price. They measure the rate of change to signal whether a trend is accelerating, slowing down, or on the verge of reversing.
Here are two essentials for your toolkit:
- Relative Strength Index (RSI): This popular tool measures the speed and change of price movements on a simple 0 to 100 scale. Its primary use is to identify overbought (typically a reading above 70) or oversold (below 30) conditions, which can hint at a coming pause or reversal.
- Moving Average Convergence Divergence (MACD): The MACD uses two moving averages and a histogram to reveal shifts in a trend's strength, direction, and momentum. A "crossover" of its lines is a classic buy or sell signal used by traders everywhere.
The table below breaks down these core indicators and a few others to help you see how they fit into a broader strategy.
Key Technical Indicators and Their Strategic Use
This table summarizes the primary function of essential technical indicators to help investors choose the right tool for their analysis.
By combining trend-following tools like moving averages with momentum oscillators like the RSI and MACD, you build a powerful, multi-layered view of any stock's price action. A robust technical setup isn't complete without access to good software; exploring charting and analysis tools like TradingView is a great way to start visualizing this data for yourself.
How to Recognize Actionable Chart Patterns
Once you've got your core toolkit sorted, the next level in the technical analysis of stocks is learning to spot the recurring shapes that pop up on a chart. These are chart patterns, and they're really just visual records of the constant tug-of-war between buyers (demand) and sellers (supply). When you understand them, you can start translating what looks like random price squiggles into practical, actionable insights.
Think of these patterns as the market’s body language. Just like a person's posture can give away confidence or hesitation, chart patterns reveal the collective mood of investors. If you can learn to read this language, you're in a much better position to anticipate where a stock might be headed next.
Trend Continuation Patterns
Some of the most dependable patterns are the ones that suggest an existing trend is simply taking a breather and is likely to keep going. We call these continuation patterns. They usually show up as brief pauses or periods of sideways action before the stock gets back to its original trajectory.
Two classics you’ll see all the time are flags and pennants:
- Flags: These look like small rectangular channels that angle against the main trend. For instance, a stock in a strong uptrend might pull back in a slight downward-sloping flag before it breaks out and pushes higher.
- Pennants: These are similar to flags but look like small, symmetrical triangles that form after a very sharp move. They signal a short-term standoff between buyers and sellers before the next leg of the trend kicks in.
What makes these patterns so valuable is that they show a market pausing in a healthy way. The initial powerful move shows there's real conviction, and the consolidation period just lets new buyers jump on board before the next push. A breakout from one of these patterns—especially on higher-than-average volume—is a strong sign the trend is still very much alive.
This infographic shows how different technical tools can be layered together to give you a complete picture of the market's health, from its overall direction to its underlying momentum.
The key takeaway here is that no single indicator ever tells the whole story. You get a much more reliable framework when you combine signals for trend, momentum, and overbought/oversold levels.
Trend Reversal Patterns
Just as important are the patterns that warn you a trend might be running out of steam. These reversal patterns are your cue to protect profits or avoid buying a stock just as it's about to roll over. They tend to form more slowly than continuation patterns because it takes time for market sentiment to shift from bullish to bearish, or vice versa.
A chart pattern is a map of market psychology. It’s not a guarantee of future performance but a probabilistic guide that helps you frame risk and reward based on historical price behavior.
One of the most famous reversal patterns is the Head and Shoulders. This one usually forms at the top of an uptrend and looks like three peaks: a central, higher peak (the "head") with two lower peaks on either side (the "shoulders").
The critical line to watch is the "neckline," which connects the lows of the troughs between the three peaks. A decisive break below this neckline, particularly with an increase in volume, is a powerful signal that the uptrend is over. The psychology is pretty straightforward: buyers tried three times to push the price to new highs and failed, which finally gave sellers the confidence to take control.
Other important reversal patterns include Double Tops (which look like an "M") and Double Bottoms (a "W" shape), both of which signal a similar tug-of-war where one side eventually gives up.
The Critical Role of Confirmation
Spotting a pattern is only half the job. A pattern is just a hypothesis, not a sure thing. To really stack the odds in your favor, you have to look for confirmation from your other indicators.
For example, if you see a bullish flag pattern forming, you need to see a corresponding spike in trading volume when the price breaks out above the flag's upper boundary. That volume surge confirms that buyers are back in force and are serious about pushing the price higher. Without it, the breakout might be a "fakeout" that quickly fails.
Likewise, seeing a Head and Shoulders breakdown confirmed by a bearish MACD crossover or a weak RSI reading adds a ton of weight to the bearish signal. The pattern tells you what might be happening; confirmation tells you why it's happening now.
Combining Technical and Fundamental Analysis
Too many investors get stuck in a pointless debate: technical versus fundamental analysis. They treat them like rival schools of thought, forcing you to pick a side.
That’s a classic rookie mistake. The sharpest investors understand that these two disciplines aren’t at odds at all. They’re two sides of the same coin, each answering a different—but equally critical—question about an investment.
Think of it this way: fundamental analysis tells you what to buy, while technical analysis tells you when to buy. One is about identifying quality, the other about identifying opportunity. When you put them together, you get a powerful, disciplined framework for making smart decisions with your capital.
What to Buy vs. When to Buy: The Core Synergy
At its heart, fundamental analysis is about figuring out what a company is truly worth. This is the deep-dive work: poring over financial statements, sizing up the management team, and understanding where the company sits in its industry. We get into the weeds on this in our guide to the fundamental analysis of stocks. After all that work, you might find a fantastic company with a rock-solid balance sheet and incredible growth ahead.
But here’s the catch: a great company isn't always a great investment at this exact moment. And that’s where technical analysis earns its keep.
The stock of that amazing company you found could be caught in a brutal, gut-wrenching downtrend. Anyone jumping in based on fundamentals alone is just asking to see red in their portfolio. Technical analysis is your timing tool. It helps you see the sentiment on the chart, wait for the selling pressure to dry up, and spot the first signs that buyers are stepping back in before you commit your money.
By layering technical signals over a foundation of solid fundamental research, you combine the “what” with the “when,” leading to better entry points, more disciplined risk management, and a higher probability of success.
This dual-lens approach is your best defense against common traps, like falling in love with a great business but buying it at a terrible price, or panic-selling a solid long-term holding during a temporary market freak-out.
Putting It All Together for Better Decisions
So, how does this actually work in a real-world portfolio? It’s all about using technical tools to time and manage the best ideas your fundamental research uncovers. It’s what turns abstract theory into actionable trades. A key part of your fundamental homework will naturally involve understanding how to read financial reports to get a clear picture of a company's financial health.
Here’s how these strategies can work together on the ground:
- Timing Your Entry: You’ve done your homework and found a quality company. Instead of just buying it, you watch the chart. You wait for the stock to break out of a consolidation pattern or bounce firmly off a key support level, like its 200-day moving average, before you pull the trigger.
- Managing Your Risk: You can set a stop-loss order based on a clear technical level. Maybe you place it just below a recent swing low or a long-term moving average. This defines your risk right from the start, protecting your capital if your thesis doesn't play out as expected.
- Sizing Your Position: If a stock is showing powerful technical momentum—trading above all its key moving averages on high volume, for example—you might feel confident taking a larger position. On the other hand, if the chart looks a bit shaky, you could start with a smaller, "feeler" position and add to it later.
This integrated approach forces a level of discipline that’s often missing when you rely on just one method.
Navigating Long-Term Market Cycles
This isn't just about picking individual stocks; it’s also about understanding the big picture. Technical analysis is deeply intertwined with long-term market cycles and statistics.
Just look at the research from Guggenheim, which analyzed S&P 500 data from 1957 to 2024. They identified six massive secular bull markets and six secular bear markets. These are multi-year cycles with wildly different outcomes for investors. While the S&P 500’s long-term annualized return is around 10.46%, getting caught on the wrong side of a secular bear market can mean years of volatile or flat returns.
Technicians use tools like long-term moving averages to gauge whether the market is in a healthy uptrend or a dangerous downtrend, adjusting their risk exposure accordingly. It's a disciplined, data-driven way to navigate these huge market waves, and it perfectly complements a fundamentally driven asset allocation strategy. You can explore Guggenheim's research on historical S&P 500 trends to see this powerful data for yourself.
Using Technical Analysis for Risk Management
For high-net-worth portfolios, protecting capital is just as important as growing it. While many people think of technical analysis as a tool for picking winners, its real power for a seasoned investor is in building a disciplined, data-driven framework for managing risk. It's how you define your downside, protect your gains, and make clear-headed decisions when the market gets choppy.
At its core, technical analysis is a game of probabilities. We know that price action isn't perfectly predictable, but it’s not completely random, either. Over time, certain chart patterns and market behaviors pop up again and again, allowing us to build rules for getting in and out of trades based on repeatable, statistically supported behavior, not just gut feelings.
Setting Stops and Sizing Positions
A cornerstone of any solid risk plan is knowing your exit point before you even enter a trade. The technical analysis of stocks gives you clear, objective levels for placing stop-loss orders, turning a potentially emotional decision into a pre-planned, logical action.
- Support-Based Stops: One of the most common strategies is to place a stop-loss just below a key support level, like a recent swing low or a major moving average. If the price breaks through that floor, it’s a strong signal that sentiment has soured and it's time to get out to protect your capital.
- Volatility-Based Stops: For a more tailored approach, indicators like the Average True Range (ATR) can measure a stock’s typical price swings. This lets you use a wider stop for a volatile stock and a tighter one for a stable one, adapting your risk to the asset's personality.
This technical groundwork also dictates your position sizing. Once you’ve set your stop-loss, you know exactly how much you stand to lose on each share. From there, you can calculate the right number of shares to buy so that a potential loss never exceeds an acceptable percentage of your total portfolio, like 1% or 2%.
Defining Your Risk-to-Reward Ratio
Before you ever click "buy," you have to ask one simple question: "Is the potential upside worth the risk?" Technical analysis makes answering that question incredibly straightforward.
By looking at a chart, you can spot the key support level (your potential risk) and the nearest resistance level (your potential reward). A good trade is one where the distance to your profit target is much greater than the distance to your stop-loss.
A common rule of thumb is to only take positions that offer at least a 2:1 risk-reward ratio. This means for every dollar you risk, you have the potential to make at least two. This discipline ensures that over the long haul, your winning trades will more than pay for your losing ones.
This simple calculation, guided by the chart, stops you from jumping into low-probability trades where the reward just doesn't justify the risk. It’s a foundational piece of long-term success.
Hedging Your Portfolio With Broad Market Signals
Finally, technical analysis isn’t just for individual stocks. It’s also a powerful tool for gauging the health of the entire market. Signals from major indexes like the S&P 500 can help you decide how much overall market exposure you should have.
For example, when the S&P 500 crosses below its long-term 200-day moving average, it has historically been a warning sign of a potential bear market or a major correction. For a wealth manager, that doesn’t mean you sell everything. Instead, it might be a trigger to play defense: trim some high-flying positions, raise your cash allocation, or perform a strategic rebalance. By paying attention to these big-picture technical signals, you can proactively adjust your portfolio’s risk level and protect your gains when the market starts to look weak.
Common Questions Answered
Let's tackle some of the most common questions that come up when we talk about using technical analysis for wealth management. The goal here is to give you clear, straight-ahead answers so you can apply these tools with more confidence.
Can Technical Analysis Actually Predict Stock Prices?
Not with a crystal ball, no. Technical analysis is really about managing probabilities, not predicting the future with 100% certainty. It helps us spot trends, patterns, and behaviors in the market that suggest one outcome is more likely than another.
Think of it less like a psychic reading and more like a sophisticated weather forecast for the market. It uses historical price and volume data to give us a data-driven outlook, helping you make smarter decisions and manage risk. It's about getting the odds in your favor, not about guarantees.
Is This Stuff Just for Day Traders?
That’s a common misconception, but technical analysis is incredibly valuable for long-term investors, too. For our clients, we often look at weekly or monthly charts and use long-term indicators, like the 200-day moving average, to gain a real strategic edge.
This bigger-picture view helps us identify major market cycles, find much better entry points for core holdings, and wrap a disciplined risk management strategy around a fundamentally solid portfolio. It brings a crucial layer of timing and discipline to long-term investing.
The most powerful investment strategies often combine the "what to buy" of fundamental analysis with the "when to buy" of technical analysis. This blend ensures you're putting capital to work in quality assets at the most opportune moments.
How Many Indicators Should I Be Using?
When it comes to indicators, less is almost always more. One of the costliest mistakes we see is what’s called "analysis paralysis"—cluttering up a chart with so many conflicting signals that it becomes impossible to make a decision. The objective should be a clear, repeatable process, not a complex mess.
A much better way to go is to master just a few complementary tools that give you a complete picture. For instance, a solid setup might include:
- A moving average to get a feel for the trend's direction.
- An oscillator, like the RSI, to gauge momentum.
- Volume analysis to confirm the strength behind a move.
What's the Single Biggest Mistake Investors Make?
Hands down, the most common mistake is ignoring risk management. It's easy to get so focused on hunting for the perfect entry signal that you completely forget to define your exit plan or figure out how much you're willing to lose if the trade goes south.
A successful technical approach always begins with risk. Before you even think about buying, you have to know your stop-loss level, calculate your position size based on that risk, and make sure the potential upside is worth the risk you're taking.
At Commons Capital, we blend disciplined technical analysis with deep fundamental research to guide our clients through today's complex markets. If you’re ready to build a more strategic and risk-aware investment plan, we invite you to connect with our team.