
Fundamental analysis of stocks is the disciplined art of figuring out what a company is actually worth, completely separate from the day-to-day noise and hype of the stock market. At its core, it’s about looking at a business’s financial health, the quality of its leadership, and its position in the market to decide if its stock is a smart long-term investment.
Thinking Like an Investor, Not a Speculator
Before putting a single dollar to work, you have to get one thing straight: the difference between investing and speculating. A lot of people mix them up, treating the stock market like a casino where the only goal is a quick win. That’s not investing; it’s speculation—just betting on price movements without truly understanding what you own.
An investor, on the other hand, thinks like a business owner.
Imagine you were thinking about buying a local coffee shop. You wouldn't just look at the asking price and say yes or no. You'd be in there for weeks, digging into sales figures, checking profit margins, talking to the manager, and sizing up the competition down the street. That, in a nutshell, is the heart of fundamental analysis.
The Two Pillars of Analysis
To build that durable, owner's perspective, fundamental analysis rests on two main pillars. You need both to get the full picture of a company’s health and where it's headed.
- Quantitative Analysis (The Numbers Story): This is all about digging into a company's financial statements—the income statement, balance sheet, and cash flow statement. It’s the world of objective data: revenue growth, debt levels, profitability ratios. These numbers tell you the story of how the company has performed and how strong its finances are right now.
- Qualitative Analysis (The Business Story): But numbers on a page never tell the whole story. This second pillar looks at the non-numerical stuff that really drives success. We’re talking about the quality of the management team, the power of its brand, any competitive advantages (often called a "moat"), and the dynamics of the industry it operates in.
Adopting an investor's mindset means you're buying a piece of an actual business, not just a ticker symbol that bounces around all day. The goal is to find great companies with real, lasting value that can steadily grow your wealth over the long haul.
When you combine both quantitative and qualitative insights, you start to see past the distractions of daily market swings. You learn how to spot well-run businesses that are trading at fair prices, which is the foundation for building a truly resilient portfolio. This guide will walk you through exactly how to do that, starting with the numbers.
Reading the Numbers in Financial Statements
Every company tells a story, and its financial statements are where that story is written down in black and white. For any investor serious about fundamental analysis, learning to read these documents isn't just a good idea—it's non-negotiable. This is where you find the raw data to understand a company's past performance and current financial health, turning your analysis from guesswork into an evidence-based evaluation.
These documents aren't just for accountants; they are the primary tools for seeing how a business really operates. They show you where the money comes from, where it goes, and what the company owns versus what it owes. By putting these reports together, you can build a surprisingly clear picture of a company's stability and potential.
The whole process boils down to balancing the hard numbers with the bigger picture, as this graphic shows.
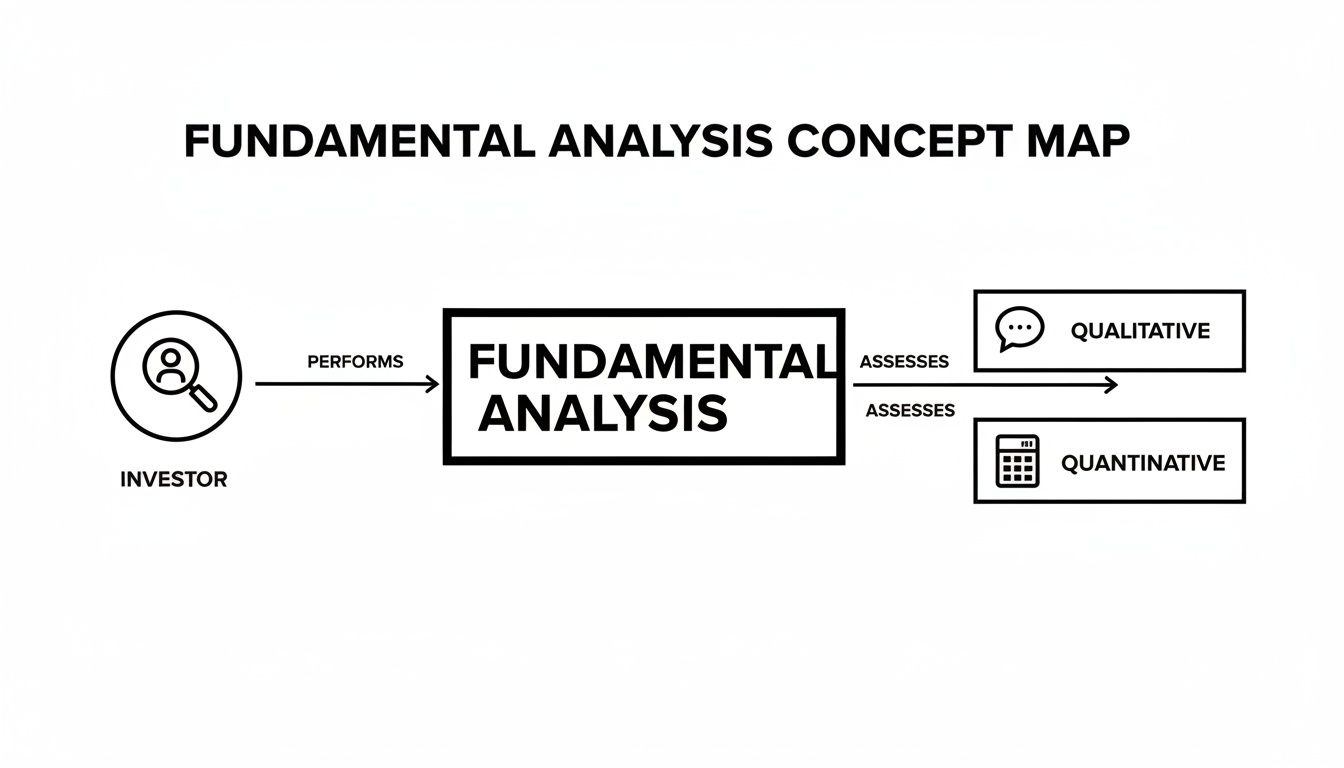
You need both the quantitative (the numbers) and the qualitative (the story) to make truly informed decisions. Let's start with the numbers.
The Three Core Financial Statements
At the heart of any fundamental analysis are three key documents. Each one offers a different angle on the business's health, and together they create a three-dimensional view.
Here's a quick breakdown of what each statement tells you and why it matters.
Understanding the Three Core Financial Statements
Think of them as a team: the Income Statement shows performance, the Balance Sheet shows stability, and the Cash Flow Statement reveals the real-world liquidity. Now, let's look at each one a bit closer.
The Income Statement: A Story of Profitability
First up is the Income Statement, often called the Profit and Loss (P&L) statement. Think of it as a movie showing the company’s financial performance over a certain period, like a quarter or a full year. It starts with total revenue at the top line and then subtracts all the various costs and expenses to land on the final number: net income, or the famous "bottom line."
When you're reviewing an income statement, you’re really looking for trends. Is revenue consistently growing year after year? Are profit margins holding steady, or even better, expanding? A company that can reliably grow its profits shows it has a handle on its operations and that people actually want what it's selling.
For a deeper dive, check out our guide on how to analyze financial statements.
The Balance Sheet: A Snapshot of Financial Health
Next is the Balance Sheet, which is more like a photograph than a movie. It captures a company's financial position at one specific moment in time. The entire thing is built on a simple but powerful equation: Assets = Liabilities + Shareholders' Equity.
This statement tells you what a company owns (assets) and what it owes (liabilities). The difference between the two is the shareholders' equity—basically, the net worth of the company. A healthy balance sheet typically shows assets growing while liabilities, especially debt, are kept at a manageable level.
The real power comes not from a single report, but from lining them up over several years. A single good year can be a fluke; a five-year trend of consistent growth and financial strength reveals a resilient business built for the long haul.
The Cash Flow Statement: Following the Money
Finally, we have the Statement of Cash Flows, which tracks the actual cash moving in and out of the business. This is critical because the "profit" you see on an income statement isn't always the same as cash in the bank.
This statement is broken down into three key areas:
- Cash from Operations: Money generated from the company’s core business activities. Consistent, strong cash flow here is the hallmark of a healthy, self-sustaining operation.
- Cash from Investing: Cash spent on or received from investments, like buying new equipment or selling off a piece of property.
- Cash from Financing: Cash flows from things like issuing new stock, paying dividends to shareholders, or taking on new debt.
One of the cornerstones of fundamental analysis is digging through this historical data to find a company's true growth story and stability. For example, analysts routinely comb through years of records for thousands of public companies, tracking metrics like revenue growth and debt levels. In the aftermath of the 2008 financial crisis, backtested analyses showed that companies with a strong historical Return on Equity (ROE) above 15% actually outperformed their peers by 25% during the recovery years through 2012.
To get this analysis done efficiently, you often need to pull data from PDF reports. This is a common first step before building any financial models, so learning how to accurately copy tables from PDF to Excel can save you a ton of time and headaches.
Using Key Ratios to Uncover Hidden Value
Financial statements hand you the raw ingredients, but it's the financial ratios that provide the recipe. This is where you turn raw data into actionable intelligence.
A fundamental analysis of stocks isn't just about looking at big, raw numbers. Ratios are your financial X-ray, letting you see the underlying health and potential of a business. They give you a standardized way to compare companies, spot trends, and find opportunities that the market might be overlooking.
Think of it this way: knowing a company pulled in $100 million in profit sounds great, but what does that really tell you? Is that impressive for a company of its size? How does it stack up against its direct competitors? Ratios answer these critical questions by putting the numbers into a meaningful context, allowing for true apples-to-apples comparisons.
We can break these powerful metrics down into a few key categories, giving you a clear framework for your analysis.

How Efficiently Does the Company Generate Profits?
Profitability ratios cut right to the chase: is the business actually good at making money? They measure how well a company is using its resources—from its assets to its shareholders' equity—to generate earnings.
Here are a few of the most important ones to watch:
- Return on Equity (ROE): From a shareholder's viewpoint, this is one of the most critical measures. It tells you exactly how much profit the company squeezes out for every single dollar of equity invested. A consistently high ROE is a strong signal that management knows how to deploy capital effectively.
- Return on Assets (ROA): This ratio looks at how efficiently a company is using all its assets (cash, inventory, factories, equipment) to turn a profit. It gives you a great sense of its operational muscle.
- Gross Profit Margin: Calculated as (Revenue - Cost of Goods Sold) / Revenue, this reveals how much profit is left over after paying for the direct costs of what it sells. A stable or rising margin is a fantastic sign of pricing power and good cost control.
A company showing strong, steady profitability ratios often has a durable competitive advantage, making it a much more resilient candidate for a long-term portfolio.
How Much Financial Risk Is the Company Taking?
Leverage ratios, sometimes called solvency ratios, are your go-to risk assessment tool. They show you just how much a company is relying on debt to run its business. A little bit of debt can be a smart way to fuel growth, but too much can be a time bomb, especially when the economy sours and cash flow gets tight.
A crucial part of fundamental analysis is recognizing that a 'good' ratio in one industry can be a red flag in another. A software company is going to have a vastly different balance sheet than a capital-heavy manufacturing firm. Always, always compare a company to its direct peers for the most accurate picture.
The most well-known leverage ratio is the Debt-to-Equity (D/E) Ratio. This simply compares a company's total debt to its total shareholder equity. A high D/E ratio means the company is leaning heavily on borrowing to finance its growth, which can amplify gains but also magnify losses, jacking up its risk profile.
Is the Stock Cheap or Expensive?
At the end of the day, this is the question every investor wants answered. Valuation ratios help you decide if a stock's current price is fair, overhyped, or a potential bargain relative to its earnings, sales, or book value. They are the bridge connecting a company’s real-world performance to its stock price.
These ratios are essential for cutting through market chatter and focusing on a company’s true intrinsic value. The most famous is the Price-to-Earnings (P/E) Ratio, which compares the stock price to its earnings per share. A lower P/E often hints that a stock might be undervalued, but it's vital to check it against industry averages and the company's own historical P/E range.
Digging into metrics like the P/E ratio is where fundamental analysis really proves its worth. Research has consistently shown that stocks trading at P/E ratios below their 5-year historical averages tend to outperform by 8-10% annually in major markets. In fact, data from over 17,000 public companies reinforces this: between 2010 and 2025, S&P 500 firms with a forward P/E under 15x (compared to the index average of 22x) generated an impressive 14.2% in compounded returns. You can learn more about how to spot these opportunities from industry research platforms like Alpha Sense.
Looking Forward with Valuation Models
Digging through historical financial statements gives you a solid rearview mirror, but investing is all about looking through the windshield. Past performance is crucial context, no doubt. But the real goal of a fundamental analysis of stocks is to figure out what a company will be worth in the future. This is where valuation models come into play.
These aren't crystal balls, of course. Think of them as structured frameworks that help you translate future expectations into a concrete estimate of a company's intrinsic value. They're the bridge between what a business has done and what it's likely to do, helping you make decisions based on a stock's potential, not just its past.
The goal isn't to get lost in a spreadsheet of complex formulas, but to understand the logic behind these powerful methods. Two primary approaches really dominate this forward-looking analysis: calculating a company's standalone worth and simply comparing it to its peers.
Discounted Cash Flow: The Art of Valuing Future Profits
One of the most respected methods in fundamental analysis is the Discounted Cash Flow (DCF) model. The core idea is simple but incredibly powerful: a company's true value is the sum of all the cash it's expected to generate in the future. The only catch? A dollar tomorrow is worth less than a dollar today.
Imagine someone offered you $1,000 today or $1,000 five years from now. You’d take the money today, right? Of course. That's the time value of money in action—you could invest today's dollar and watch it grow. DCF applies this exact logic to a business by projecting its future cash flows and then "discounting" them back to what they're worth in today's dollars.
This method forces you to think critically about a company's long-term story:
- How fast can it realistically grow its earnings?
- Will its profit margins hold up against competition?
- What are the risks that could throw a wrench in its plans?
A DCF analysis ultimately gives you a single, powerful number: an estimated intrinsic value per share. If that value is significantly higher than the current stock price, you might just have found an undervalued gem.
Relative Valuation: Comparison Shopping for Stocks
The other key approach is Relative Valuation, which is a lot like comparison shopping for a car. Instead of trying to calculate a precise intrinsic value from scratch, you compare a company to its direct competitors using standardized metrics, like the classic Price-to-Earnings (P/E) ratio.
The logic is straightforward: similar companies in the same industry should trade at similar valuation multiples. If one company is trading at a much lower P/E ratio than its peers despite having similar growth and profitability, it might be a bargain.
This method is popular because it's grounded in current market sentiment and is a lot simpler to apply than a full DCF. But you have to be careful you're making true apples-to-apples comparisons. A mature, stable utility company will have a very different P/E ratio than a high-growth tech startup, even if they're both in the S&P 500. This is why understanding the context behind the numbers is so critical.
The earnings and revenue growth trends that fuel these models are the heartbeat of any good fundamental analysis. History shows us, time and again, that companies capable of sustaining a 15%+ compound annual growth rate (CAGR) over five or ten years are the ones that truly drive long-term returns. According to data from major stock exchanges, S&P 500 leaders with strong revenue CAGRs delivered shareholder gains that blew past the index average. This resilience is especially clear in downturns; during the market drop in 2022, companies with historical profit margins over 10% declined far less than the broader market.
Finding Great Companies Beyond the Numbers
A company's real story isn't just buried in spreadsheets. While financial ratios and valuation models give you a critical quantitative foundation, the most durable long-term investments are often defined by things you can't neatly plug into a formula. A truly thorough fundamental analysis of stocks means you have to look past the numbers and dig into the qualitative side of the business.
This is where you investigate the intangible assets that separate a good company from a truly great one. These factors are the why behind the numbers—they explain why a company is profitable and, more importantly, whether that success can last. If you ignore them, you're only getting half the picture.
Uncovering the Competitive Moat
The idea of a competitive moat is one of the most powerful concepts in investing. Popularized by Warren Buffett, it's a company's ability to maintain a lasting competitive advantage that protects its profits from rivals, just like a moat protects a castle. A wide moat is what allows a business to generate high returns on capital year after year.
Think of it as the secret sauce that keeps customers locked in and competitors out. This edge can show up in many forms, and identifying a strong one is a cornerstone of any solid qualitative analysis.
Here are the key types of moats to look for:
- Intangible Assets: This covers powerful brands that command fierce loyalty (think Apple or Coca-Cola), patents that shield unique technology, or regulatory licenses that are tough for newcomers to get.
- High Switching Costs: A company has a strong moat when it's a massive headache for customers to switch to a competitor. This is common with software platforms where users have invested tons of time and data.
- Network Effects: This happens when a product or service gets more valuable as more people use it. Social media platforms like Meta are the classic example; the value comes from the massive user base itself.
- Cost Advantages: Some companies can simply make things or provide services far cheaper than their rivals. This lets them either undercut on price or enjoy fatter profit margins. It might stem from superior processes, proprietary tech, or massive economies of scale.
Assessing Management Quality and Governance
Even a business with the widest moat can crumble under poor leadership. Evaluating a company's management team is a critical, though subjective, part of the process. You are, after all, trusting these people to make smart decisions with your capital.
Look for a leadership team with a proven track record of excellent capital allocation. How have they handled past acquisitions? Do they pour money into projects that generate strong returns, or do they squander it on ego-driven ventures?
A key sign of a shareholder-friendly management team is transparent communication and a clear alignment of their interests with those of investors. Reading a CEO's annual letter to shareholders can often reveal more about their long-term vision and integrity than any financial statement.
Beyond their track record, look at their corporate governance. Are they accountable to shareholders? Do they have a history of treating investors fairly? Strong governance lowers risk and is often the hallmark of a well-run, sustainable business.
Understanding the Bigger Picture
Finally, no company operates in a vacuum. A complete fundamental analysis requires you to zoom out and assess the broader industry landscape and the macroeconomic environment.
Start by asking questions about the industry itself. Is it growing or in decline? What are the competitive dynamics like? An industry plagued by intense price wars and low barriers to entry is a tough place for any company to thrive, even a well-run one. Understanding these dynamics helps you see if a company is riding industry tailwinds or succeeding despite headwinds. These factors often play a crucial role in the ongoing debate you can explore further in our article comparing growth vs. value stocks.
On top of that, consider macroeconomic factors like interest rates, inflation, and overall economic growth. A company selling luxury goods, for example, will be far more sensitive to an economic downturn than a business selling consumer staples. This holistic approach ensures you're not just finding a good company, but a great company positioned to succeed in the world as it is.
Your Fundamental Analysis Action Plan
Knowledge without action is just trivia. We've walked through the theory behind financial statements, ratios, and all the qualitative stuff—now it's time to turn that into a practical, repeatable process. Having a structured plan is your best defense against common traps like getting buried in data or making emotional decisions.
This framework for the fundamental analysis of stocks isn’t some magic formula. Think of it as a disciplined checklist to guide your research, build real conviction in your ideas, and have smarter conversations with your financial advisor about your long-term goals.
Building Your Repeatable Research Framework
This is your pre-flight checklist before putting any capital to work. Each step builds on the last, creating a complete picture of a potential investment. A methodical approach like this ensures you cover all your bases, from the 30,000-foot view down to the nitty-gritty details.
- Start with the Big Picture: Before you even look at a specific company, you need to understand the sandbox it plays in. Is the industry growing, shrinking, or consolidating? What major tailwinds or headwinds are affecting every player? A great company in a terrible industry is often just a slow-motion train wreck.
- Gather the Financials: Get your hands on the company’s last 5-10 years of annual reports (10-Ks) and the most recent quarterly reports (10-Qs). You can find these for free on any company’s investor relations website or through the SEC’s EDGAR database. The big three you're looking for are the Income Statement, Balance Sheet, and Cash Flow Statement.
- Analyze Key Ratios and Trends: Now, calculate the key ratios we've talked about (P/E, D/E, ROE). But don't just stop at the number. The real insight comes from looking at their trends over time. Is profitability getting better? Is debt starting to creep up? Just as important, compare these ratios to the company's closest competitors to see how they truly stack up.
Beyond the Spreadsheet: What to Look For
Once you've crunched the numbers, it's time to dig into the story. This is where you shift from being an accountant to a business analyst.
- Read the CEO’s Letter: The annual letter to shareholders can be a goldmine. Does management talk candidly about their challenges, or is it all marketing fluff? A transparent, accountable leadership team is a huge green flag.
- Assess the Competitive Moat: What gives this company a durable edge? Is it a powerful brand, a network effect that gets stronger with each new user, or a rock-solid cost advantage? A business without a moat is just a sitting duck for competitors who will eventually eat away its profits.
A common trap for investors is "analysis paralysis," where the sheer volume of data leads to indecision. Your goal isn't to know everything; it's to identify the 2-3 key drivers that will determine the company's success and focus your research there.
Finally, bring it all together. Your quantitative and qualitative findings should form a clear investment thesis—a simple statement explaining why you believe the stock is a good investment at today's price. Writing it down forces you to be clear and helps you track if your original assumptions are playing out over time.
To make this process even sharper, you can also explore how to leverage AI for financial analysis to speed up data gathering and spot patterns you might have otherwise missed.
To help tie all these concepts together, here is a quick reference guide summarizing the key areas of focus.
Fundamental Analysis Quick Reference Guide
This table serves as a mental checklist to ensure you're evaluating a company from all the critical angles before making an investment decision.
Got Questions About Fundamental Analysis? We've Got Answers.
As you start digging into companies, a few questions always seem to pop up. Let's tackle some of the most common ones that investors wrestle with when they first put the fundamental analysis of stocks into practice.
How Much Time Should I Actually Spend Researching a Stock?
There’s no magic number here. The real goal isn't to clock hours, but to reach a point where you genuinely understand the business, inside and out. For some, that might mean a few dedicated weekends of digging through reports. For others, it’s a slow-burn process over several weeks.
A good rule of thumb? Keep digging until you can confidently explain your investment thesis to a skeptical friend. You need to be able to nail down what the company does, what gives it an edge over its rivals, and exactly why you think the market has got the price wrong. Trying to rush it is a surefire way to miss something critical.
What’s the Real Difference Between Fundamental and Technical Analysis?
This is a big one, and the two approaches couldn't be more different.
Think of fundamental analysis as being a business detective. You're pouring over financial statements, judging the quality of the management team, and assessing the company’s position in its industry—all to figure out what the business is actually worth. It's about buying a piece of a great company and holding on for the long haul.
Technical analysis, on the other hand, is more like being a market psychologist. It completely ignores the underlying business and focuses instead on stock charts, trading volumes, and price momentum. The entire game is about predicting short-term price swings. While some traders try to blend the two, they are entirely different disciplines with very different endgames.
How on Earth Do You Analyze a Company in a Brand-New Industry?
This is where things get tricky. Trying to analyze a company in a fast-moving field like biotech or advanced AI can feel like navigating without a map because there's often little to no historical data to lean on. When that happens, you have to shift your focus.
Instead of getting bogged down in past performance, you have to pivot hard toward the qualitative stuff. The analysis becomes all about the size of the potential market, the strength of the company’s patents or technology, and the vision—and track record—of the leadership team.
Valuation becomes less about what the company is earning today and more about what it could earn years from now. This definitely makes the analysis more speculative, but the core principles of understanding the business and its competitive moat are still your best guides. In these cases, it's wise to build a much larger margin for error into your valuation to account for all that uncertainty.
At Commons Capital, we live and breathe these complexities every day to help our clients build resilient, long-term portfolios. We use a disciplined research process to find opportunities and manage risk, making sure your financial strategy is built on a rock-solid foundation. If you're ready to get your investments working toward your long-term goals, we invite you to learn more about our wealth management services.