
Knowing when to sell a stock isn’t about trying to time the market perfectly. That’s a fool’s errand. Instead, it’s about having a disciplined strategy in place before your emotions get the better of you. The decision to sell should come from a plan you’ve already made, mixing clear-eyed analysis with smart portfolio management. This is how you protect and grow wealth for the long haul.
The Art of Selling: Why You Need a Framework
Most investors obsess over which stocks to buy but barely give a second thought to their exit strategy. This is a huge mistake, and it’s one that can lead to steep losses or leaving a ton of money on the table. For high-net-worth investors, the stakes are even higher. A single concentrated position or a snap emotional decision can seriously dent a lifetime of accumulated wealth.
Having a structured framework takes the guesswork and panic out of the equation. It turns selling from a fearful, reactive moment into a strategic, unemotional move that aligns with your financial goals. This isn't about being a pessimist; it’s about being a realist. Markets run in cycles, company fortunes can turn on a dime, and your own financial needs will change over time.
To help you get started, we'll be breaking down the sell signals into three core categories. Think of them as the pillars of a solid exit strategy.
Here’s a quick overview of what those look like.
Core Reasons to Consider Selling a Stock
By building rules around these pillars, you create an essential buffer against the behavioral biases—like fear of loss or greed for more—that trip up so many investors.
Let's dig a little deeper into what each of these pillars really means.
The Three Pillars of a Selling Strategy
Developing a tough, disciplined selling mindset means keeping a close eye on three different areas. Each one gives you a unique lens to look through when evaluating your holdings, which leads to a much more rounded and logical decision.
- Deteriorating Business Fundamentals: This is all about tracking the actual health of the company you own. Has its competitive edge started to dull? Is revenue growth slowing to a crawl? These are real-world signs that your original reason for buying the stock might not hold up anymore.
- Proactive Portfolio Management: Sometimes you have to sell a great company for purely strategic reasons. This could mean rebalancing your asset allocation, managing risk when one stock becomes too big a slice of your portfolio pie, or harvesting losses to offset your tax bill.
- Objective Market Signals: Using data-driven flags can help you sidestep emotional traps. Maybe you decide to sell when a stock's valuation gets stretched to an unsustainable high. Or maybe your trigger is when it breaks below a key long-term trend line, hinting that market sentiment is shifting.
A good stock is a good stock regardless of price. The price of a stock does not determine if it's good or not. It's time to sell when the company itself...is no longer in favor.
This disciplined approach is absolutely critical for navigating the market's constant ups and downs. If you're looking to build out your own system, check out this a comprehensive guide on when to buy and sell stocks for a broader perspective.
When a Great Company Starts to Stumble
Every investment starts with a thesis—the story you tell yourself about why a company is a great buy. Maybe it was their game-changing tech, a rockstar CEO, or a competitive advantage that seemed unbeatable. The single best reason to hit the "sell" button is when that story breaks down.
Day-to-day stock price swings are mostly noise. The real signal comes from the health of the business itself. Selling based on fundamentals means putting on your detective hat and looking for clues that the powerhouse you bought into is losing its edge. It’s about tuning out the market chatter and focusing on hard evidence.
The Erosion of a Competitive Moat
A company's competitive "moat" is whatever protects it from rivals, just like a real moat protects a castle. When those defenses start to crumble, it's a huge red flag. This erosion can happen for all sorts of reasons, but the result is the same: the company's long-term ability to make money is in jeopardy.
Think about Blockbuster. They were a giant, but they completely missed the threat from Netflix's streaming model until it was far too late. A new, nimbler competitor can pop up with a better product or a smarter business model and slowly steal your company's lunch. Sometimes it's not a direct competitor, but a shift in what customers want or a new regulation that makes a once-powerful advantage worthless.
Spotting this decay requires paying close attention. You should be asking yourself:
- Is the company losing customers to someone new? Keep an eye on customer acquisition numbers and churn rates.
- Did a key patent just expire? In industries like pharma, this can open the floodgates to a wave of generic competition.
- Is the brand losing its shine? A dip in brand loyalty or a string of bad press can seriously hurt sales and pricing power.
A weakening moat is often the first crack in the foundation. It's a clear signal to ask whether your original investment thesis still makes sense.
Declining Financial Health
While a weakening moat can be a bit subjective, deteriorating financials are the cold, hard numbers that tell the story. These are often the most direct signs that a great company is starting to stumble. You don't have to be a forensic accountant, but you do need to watch for a few key warning signs.
Consistently slowing revenue growth is a big one. A single bad quarter can happen to anyone, but a steady downward trend suggests the growth engine is sputtering. Maybe the market is saturated, competition is heating up, or they've just stopped innovating.
A stock's price does not determine if it's good or not. It's time to sell when the company itself...the people who are running the company, it's no longer in favor.
Profitability is just as critical. Are profit margins getting squeezed year after year? That tells you the company is either losing its ability to set prices or its costs are running wild. Either way, it means competition is forcing their hand or internal problems are eating away at their profits. A company that can't stay profitable is on a dangerous road.
Finally, keep an eye on the balance sheet. A sudden spike in debt is a major red flag, especially if it's not being used to fund smart growth. Piling on debt makes a company fragile during economic downturns and limits its ability to invest in the future. Learning how to analyze financial statements is a crucial skill for spotting these trends before they become obvious to everyone.
A Change in Leadership or Strategy
Sometimes, the threat isn't from the outside—it's coming from inside the house. A major leadership change can completely alter a company's path. When a visionary founder or a highly effective CEO walks out the door, it can create a vacuum of uncertainty and a loss of strategic direction.
Just think of Apple after Steve Jobs. The company has obviously done well under Tim Cook's steady hand, but that initial transition was filled with doubt about whether the magic was gone. If new management comes in and starts making radical changes to a winning strategy, it’s a perfectly valid reason to reconsider your investment. This is especially true if the new plan involves abandoning the core business that made the company a winner in the first place.
At the end of the day, selling because the fundamentals are deteriorating is about one thing: recognizing that the facts have changed. It's the most disciplined reason to sell, protecting your capital from a business whose best days may be in the rearview mirror.
Using Market History as Your Guide
If a company’s fundamentals start to crumble, you have a pretty clear, business-driven reason to sell. But sometimes, the biggest threats don’t come from a single company—they come from the entire market.
We’ve all seen it happen. Emotions are an investor's worst enemy, pushing us to buy at euphoric peaks and sell during panicked lows. To avoid these classic blunders, you need objective, data-driven tools that act as an emotional circuit breaker.
That's where market history comes in. By studying past cycles, we can spot patterns and technical signals that tell us when risk is piling up. This isn't about perfectly timing the market—that's a fool's errand. It’s about setting up unemotional sell triggers to protect your capital when the crowd gets a little too detached from reality.
The 200-Day Moving Average: A Simple Trend Indicator
One of the most reliable and straightforward technical tools out there is the 200-day moving average (MA). Just think of it as the long-term trend line for a stock's price. It smooths out all the day-to-day noise, giving you a clean look at whether the stock is in a real uptrend or a downtrend.
When a stock is consistently trading above its 200-day MA, it’s a good sign of positive momentum and a healthy trend. But a decisive break below that line? That's often an early warning. It suggests the underlying strength has weakened and sellers are starting to call the shots.
For many disciplined investors, a stock closing below its 200-day MA isn't just a suggestion; it's a non-negotiable sell signal. It’s a black-and-white rule that takes all the emotion and guesswork out of the equation.
- What it Signals: A potential reversal from a long-term uptrend to a downtrend.
- Why it Matters: It helps you get out of a weakening stock before a small dip turns into a painful nosedive.
- How to Use It: Set an alert or just check this metric every so often. If a stock you own breaks below this key level and stays there, it’s your trigger to sell the position.
This simple rule forces you to respect the trend, preventing you from just holding on and hoping for a rebound that might not be coming.
The Dangers of Following the Crowd
Another powerful, data-backed signal is market sentiment. History has shown, time and again, that when everyone is wildly optimistic—what we call "extreme optimism"—the market is often at its most dangerous. This is the peak of financial risk, right before a major downturn.
The crowd is notoriously wrong at big turning points. When the financial news is all sunshine and rainbows and everyone you know is bragging about their stock market winnings, that's a signal to be cautious, not greedy.
It's hard to overstate the cost of following the herd. Ned Davis Research looked at 92 instances of extreme crowd sentiment since 1996 and found that the crowd was right only once. An investor who followed their lead at these peaks would have missed out on over 12,000 S&P 500 points.
This counterintuitive thinking is what preserves wealth. A key historical signal for selling a stock actually revolves around the 200-day MA trend. According to extensive data, buy signals are triggered when the average is rising, while sell signals activate precisely when it begins to fall. You can learn more about how to interpret these historical returns.
Creating Your Own Rules-Based Triggers
The beauty of using market history as your guide is that you don't have to predict the future. You just have to react to objective signals that have proven themselves over time. If you’re invested in volatile industries or hold high-growth stocks, this kind of discipline is absolutely essential.
Think about establishing a few simple rules for your own portfolio. They could be something like this:
- The Moving Average Rule: I will sell any stock that closes below its 200-day moving average for three straight days.
- The Drawdown Rule: I will sell any stock that drops 20% from its recent high, no matter how much I love the company. This is a basic stop-loss to cap the potential damage.
- The Sentiment Rule: When a gauge like the CNN Fear & Greed Index hits "Extreme Greed," I'll trim my most overvalued positions.
These kinds of rules create a framework that removes emotion from the picture, helping you sidestep the behavioral biases that trip up so many investors. By letting data and history guide your hand, you can protect your portfolio from the major market corrections that can completely devastate long-term returns.
Selling When Valuations Get Stretched Too Thin
Even the greatest company on earth can be a terrible investment if the price gets completely detached from reality. When market euphoria takes over, valuations can climb to levels that are simply unsustainable. A huge part of knowing when to sell is recognizing these moments of extreme overvaluation before the party ends and the market corrects itself.
This isn't about perfectly timing the market top—that's a fool's errand. It's about using broad, data-driven metrics to get a feel for when risk is hitting a fever pitch. For high-net-worth families, paying attention to these big-picture warnings is crucial for protecting capital by trimming positions before the inevitable pull-back.
The Buffett Indicator: A Bird's-Eye View of the Market
One of the most straightforward tools for this is the "Buffett Indicator." It's a simple, high-level metric that compares the total value of all U.S. stocks to the country's economic output (GDP).
Think of it like a price-to-sales ratio for the entire U.S. economy. When the indicator is low, it suggests stocks are cheap relative to the underlying economy. But when it gets extremely high, it's a flashing red light that stock prices have raced far ahead of the economic growth that’s supposed to justify them.
Historically, whenever this indicator has spiked, a major market correction wasn't far behind. It gives you a clear, unemotional signal that the market might be overheated and it’s a smart time to think about taking some chips off the table.
Listening to the Echoes of History
Beyond single metrics, long-term historical charts can offer some powerful context. Take the 100-year logarithmic trendline that connected the market peaks of 1929 and 2000. This line has acted as a sort of historical ceiling for market valuation over an entire century.
When the market starts knocking on that ceiling, it's historically been a moment of maximum financial risk. It doesn't mean a crash is coming tomorrow, but it certainly suggests the odds are getting stacked against you.
Market valuation tools like the Buffett Indicator provide a potent statistical trigger for selling. It has hit extreme levels only three times in over 60 years—and each time, it was followed by declines of at least 25%. The 100-year logarithmic trendline connected the 1929 peak (before an 85% crash) and the 2000 peak (before a 55% Dot-Com bust), warning of potential drops of a similar scale.
For savvy investors, these data-driven warnings are invaluable. They offer a logical reason to reduce your exposure when risk is clearly elevated, helping you sidestep those devastating plunges.
Going Deeper with Cyclically Adjusted Valuations
While the Buffett Indicator gives you the view from 30,000 feet, other tools can offer a more granular perspective. The Cyclically Adjusted Price-to-Earnings (CAPE) ratio, for instance, provides a more stable look at a stock's value by averaging its earnings over a 10-year period. This smooths out the bumps of the business cycle.
The CAPE ratio helps you compare a stock's current price to its inflation-adjusted historical earnings, giving you a much better sense of whether it's genuinely expensive or just having one great year. You can learn more about the Shiller P/E Ratio and how to use it to add another layer of sophisticated analysis to your selling decisions. Combining these tools gives you a far more robust framework for spotting when valuations have gone too far.
Selling to Manage Your Portfolio and Mitigate Risk
Sometimes, the best reason to sell has nothing to do with the stock itself. The company could be firing on all cylinders, the market could be humming along, but the decision to sell comes from a much more personal place: your own financial well-being.
It can feel completely backward to sell a winner. But it’s often one of the smartest, most disciplined moves you can make to protect your wealth. A fantastic company can turn into a terrible risk if it grows to dominate your portfolio, and this is where shrewd portfolio management comes in.
Rebalancing to Maintain Your Target Allocation
Think about the portfolio you first designed. Maybe it was a classic 60% stock and 40% bond mix. After a great run in the market, you check your balances and realize your stocks have performed so well they now make up 75% of your holdings. That’s a great problem to have, but it’s still a problem. Your portfolio is now far more aggressive—and riskier—than you originally intended.
This is where rebalancing saves the day. It's the simple, mechanical process of selling some of what’s done well (your stocks) and using the proceeds to buy what’s lagged (your bonds) to get back to your original 60/40 split.
It’s a disciplined, unemotional way to lock in gains and ensure your portfolio stays true to your long-term goals. It forces you to sell high and buy low, preventing you from getting carried away and becoming overexposed to an asset class right before it peaks.
Trimming Concentrated Stock Positions
This is a big one, especially for executives with a lot of company stock or entrepreneurs whose wealth is tied up in the business they built. A concentrated position is when one single stock makes up an uncomfortably large slice of your net worth. It’s how fortunes are made, but it’s also how they can be lost in a flash.
As a rule of thumb, if a single stock makes up more than 5% of your total portfolio, you’re in a potentially vulnerable spot. If that one company stumbles, it could take a devastating bite out of your overall wealth.
The prudent move is to create a systematic plan to trim that position over time. This isn't a vote of no-confidence in the company; it’s a vote of confidence in your own financial security. It’s about diversifying to protect what you’ve worked so hard to build. For anyone in this situation, it's critical to understand the different concentrated stock position strategies available to unwind these positions in a tax-efficient way.
Don't forget that market history is littered with sell-offs. Since 1929, there have been 154 drops of 5% or more and 90 instances of 10% declines. Knowing how common these bumps are helps you distinguish normal volatility from a true danger signal and reinforces why managing concentration risk is so important—before a downturn hits.
Selling for Liquidity Needs or Life Events
Your financial plan isn't carved in stone; it’s a living document that has to adapt as your life changes. There are plenty of perfectly good reasons to sell a stock that have zero to do with its performance or the market's mood.
- Major Life Purchases: You might be selling to fund a down payment on a dream home, pay for your kid's college tuition, or get a new business off the ground.
- Retirement Income: Once you retire, you’ll likely be selling assets systematically to create the cash flow you need to cover your living expenses.
- Estate Planning: Selling can be part of a broader strategy to gift assets to your family or a favorite charity in a tax-smart way.
In these situations, the decision of when to sell is driven by your personal timeline, not by a chart or a headline. For those looking to generate income or hedge their risk on a large holding, exploring covered call strategies can also be a valuable tool. At the end of the day, your investments should serve your life, not the other way around.
A Practical Checklist for Making the Call
Turning abstract ideas into concrete action requires a repeatable, disciplined process. Let's be honest: haphazard decisions, fueled by a cocktail of market noise and gut feelings, are a fast track to wealth destruction. This is exactly why a pre-sale checklist isn't just helpful—it's your last line of defense against an impulsive trade you'll kick yourself for later.
Before you even think about clicking the 'sell' button, this framework forces you to pause and conduct a logical review. It makes sure that your decision on when to sell a stock is as clear-headed and well-reasoned as your initial decision to buy.
Revisit Your Original Investment Thesis
First things first: travel back to the moment you bought the stock. Pull up your notes, your research, whatever you have, and ask yourself one simple but incredibly powerful question: Has the fundamental reason I bought this company changed?
A scary-looking price dip means nothing if the underlying story is still intact. But if the company's competitive edge—its moat—is starting to look shallow, or its financial health is genuinely deteriorating, then your original thesis might not hold water anymore.
- Look for Thesis Decay: Has a disruptive new competitor entered the scene? Did a critical patent just expire? Is the leadership team making questionable moves that steer the company off course?
- Confirm Your Conviction: If the story is still strong and the price drop is just the market being the market, it might actually be an opportunity to buy more, not sell.
Assess the Stock's Valuation and Its Role in Your Portfolio
Next, take a hard look at the stock today. Has a fantastic run-up pushed its valuation into nosebleed territory? Even the world's greatest companies can become terrible investments if their stock price gets completely disconnected from reality.
At the same time, you have to consider its place in your overall financial picture. It's not uncommon for a single big winner to grow so large it completely throws your portfolio out of balance, creating a massive concentration risk that puts everything else in jeopardy.
This decision tree can help you visualize the portfolio-level questions you should be asking.
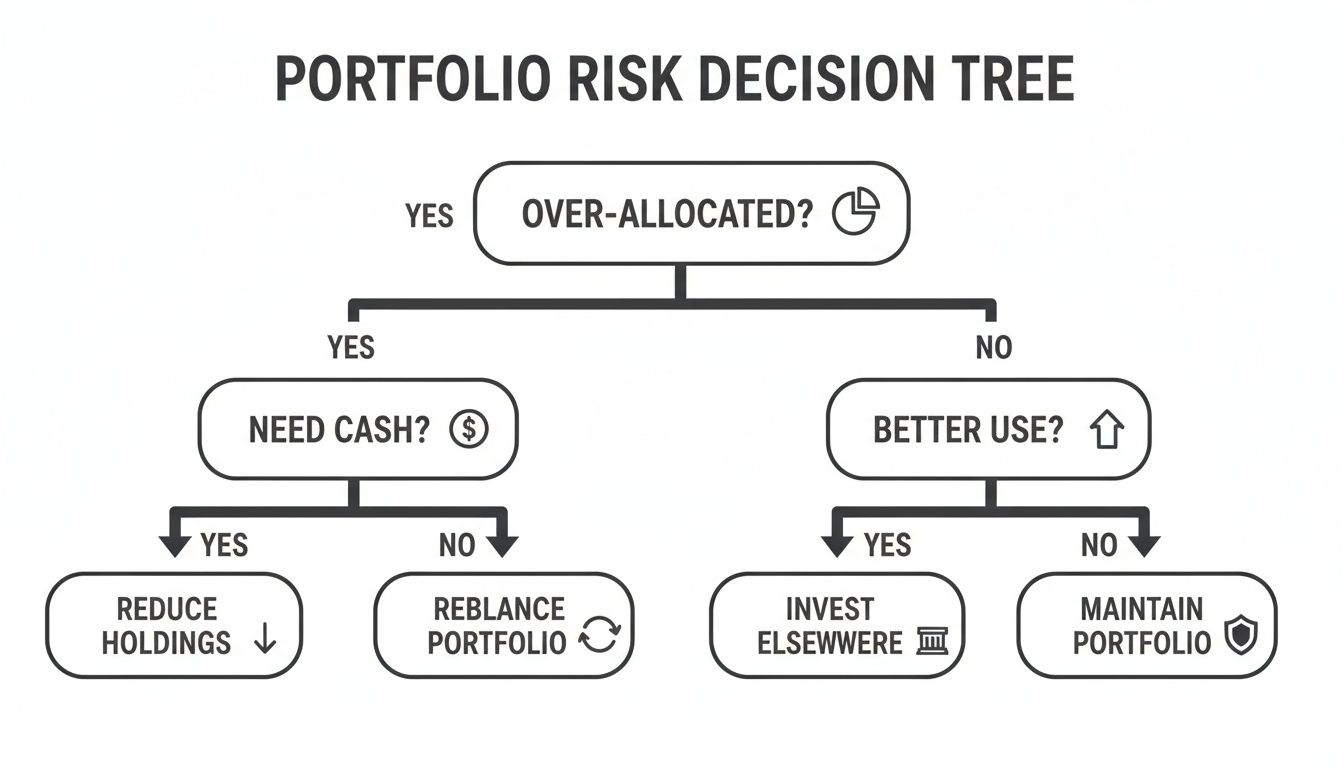
As the chart shows, key triggers for selling often come from the portfolio management side—things like being way too heavy in one stock, needing cash for a major life goal, or simply finding a much better place to put your money.
The Final Go or No-Go
Finally, it's time for an honest self-assessment. Is this decision being driven by cool-headed logic or raw emotion? Fear and greed are the twin demons of investing, and they love to show up right when the pressure is on.
Key Insight: If a stock's daily gyrations are destroying your peace of mind and keeping you up at night, it might be time to sell, regardless of the fundamentals. Your investments are supposed to serve your life, not control it.
To bring this all together, I’ve put together a simple, actionable checklist to run through before any sale. This is the final sanity check.
Your Pre-Sale Decision Checklist
A step-by-step checklist to guide your decision-making process before selling any stock, ensuring a rational and comprehensive review.
Using a tool like this transforms selling from a reactive, emotional guess into a proactive, strategic decision. It's how you ensure the choices you make today are truly aligned with where you want to be tomorrow.
Answering Your Top Questions About Selling Stocks
Deciding when to sell a stock is rarely a simple call, and it brings up plenty of tricky questions. Let's tackle some of the most common dilemmas investors run into, using the same disciplined thinking we've discussed.
Should I Sell a Stock Just Because It’s Gone Down?
Panic-selling a stock simply because the price dropped is probably one of the biggest—and most common—mistakes investors make. It’s an emotional reaction, not a strategic one. Before you do anything, go back to your original reason for buying it.
Ask yourself: has the company’s story fundamentally changed? If the business is still solid—revenues are growing, margins look good, and their competitive position is secure—then a price dip might just be market noise. In fact, if you still believe in the company for the long haul, a lower price could be a golden opportunity to buy more.
But if that price drop is a signal of real trouble, like a failing business model or a balance sheet drowning in debt, then selling is the right move to protect your capital. The price is just a symptom; you need to diagnose the cause.
How Long Is the “Right” Amount of Time to Hold a Stock?
There’s no magic number here. Your holding period shouldn't be dictated by the calendar but by your goals and your original investment thesis. Some of the greatest wealth-building stories come from investors who held great companies for decades, letting their money compound year after year.
Instead of watching the clock, watch for the real sell signals:
- The Business Is Breaking Down: The company is no longer the quality business you thought you were buying.
- Your Portfolio Needs It: The position has gotten too big, you need to raise cash, or a much better opportunity has come along.
- The Valuation Is in the Stratosphere: The stock price has soared so high it seems completely disconnected from the company's actual value, which is a big red flag for risk.
The goal of money is for you to be secure. If you have used your money to buy a stock and now you feel insecure, you need to sell that stock. If it’s keeping you up at night, you don’t own that stock—that stock owns you.
Can I Sell a Stock Right After I Buy It?
Technically, yes, you can sell a stock moments after you buy it. But this kind of quick-turnaround trading—often called "day trading"—is pure speculation, not long-term investing. It’s a completely different game with its own set of risks.
For most people, buying a stock is an act of confidence in its future. Selling it immediately suggests the decision was based on a fleeting price wiggle rather than a solid, well-researched thesis. You also need to be aware of brokerage settlement rules and, more importantly, the taxman. Short-term capital gains are usually taxed at a much higher rate than long-term gains.
Making these calls requires a clear head and a disciplined strategy. At Commons Capital, we work with high-net-worth individuals and families to manage these complexities and keep their portfolios aligned with their long-term financial goals. Learn more about our private wealth management services.


