When you look back at the history of stock market crashes, you see a powerful and oddly predictable pattern. It's a story of human behavior, where periods of wild optimism are inevitably followed by sudden, sharp drops fueled by pure panic. Understanding the major stock market crash history is crucial for any investor.
These aren't just bad days on Wall Street. A real market crash is a rapid, double-digit percentage freefall in a major stock index that happens over just a few days. The common thread tying them all together is a potent cocktail of greed, fear, and speculative frenzy.
Understanding Why Stock Markets Crash

At its heart, a stock market crash is really just a crisis of confidence. It kicks off when investors, who just yesterday were certain prices would climb forever, suddenly sprint for the exits all at once. This mass exodus creates a vicious cycle: falling prices trigger more selling, which pushes prices down even faster.
Think of it like a speculative bubble. During the boom times, investors pour money into assets, pushing their prices far beyond any reasonable value. This is often driven by a classic "fear of missing out" as it seems like everyone else is getting rich. But then, some trigger event—bad economic news, a corporate scandal, a geopolitical crisis—pricks the bubble. Almost overnight, the market's psychology flips from greed to fear.
The Anatomy of a Market Meltdown
While every crash has its own unique backstory, they tend to follow a familiar script. Understanding these stages can help demystify how a seemingly stable market can unravel so quickly.
- The Boom: A long run of rising stock prices, known as a bull market, creates a feeling of invincibility. Investors start taking on way too much risk, convinced the market only goes one way: up.
- The Peak: Valuations completely disconnect from reality. This is actually the moment of maximum financial risk, though it often feels like the safest time to be investing.
- The Trigger: A single event or piece of news shatters investor confidence, sparking the initial sell-off.
- The Panic: Fear takes the driver's seat. Investors sell everything indiscriminately just to stop the bleeding, causing the market to plummet.
A key takeaway from the history of stock market crashes is that human behavior remains remarkably consistent. While the specific financial instruments and technologies evolve, the underlying emotions of fear and greed are timeless drivers of market cycles.
Beyond the Ticker Tape
The fallout from a market crash goes far beyond investment portfolios. These events can drag economies into recession, cause widespread unemployment, and crush consumer and business confidence for years. The ripple effects are often global, as today's financial systems are all deeply interconnected.
While this article focuses on stock market history, it's worth noting that broader financial risks are part of the same picture. For instance, knowing effective foreign exchange risk management strategies is critical for any international business trying to stay afloat during economic turbulence.
Ultimately, studying these historical meltdowns offers invaluable lessons. By understanding the forces that create them, you can be better prepared for future volatility, which is a key part of gaining command over today's unpredictable market.
The Great Crash of 1929 and The Great Depression
When you think about the history of stock market crashes, one event casts a shadow over all the others: the legendary collapse of 1929. This wasn’t just numbers on a ticker tape; it was the thunderous end to a decade-long party called the Roaring Twenties. After the sacrifices of World War I, America was booming with new technology, economic growth, and a freewheeling culture.
For the first time ever, Wall Street felt like it was for everyone. Newspapers were filled with stories of shoeshine boys and telephone operators striking it rich in the market. This created a dangerous, widespread belief that stock prices had nowhere to go but up, feeding a speculative mania that was barreling toward disaster.
The Allure of Buying on Margin
The rocket fuel for this bubble was a risky practice called buying on margin. It let investors buy stocks with just a small fraction of their own money, borrowing the rest from their broker. Think of it like buying a house with only 10% down—except the "house" was a piece of paper whose value could evaporate in minutes.
It was like building a massive tower of playing cards. Every card is borrowed money, and as long as you keep stacking, the tower looks impressive. But the whole thing is fundamentally unstable. Buying on margin worked exactly the same way; it supercharged profits on the way up but guaranteed catastrophic losses on the way down.
The core problem was that the entire market was built on borrowed money and unchecked optimism. When confidence cracked, the house of cards was destined to collapse, taking the savings of millions with it.
Once prices started to slip, brokers made "margin calls," demanding investors pay back their loans immediately. To get the cash, people had to sell their stocks, which created a tidal wave of selling that turned a small dip into an all-out panic.
The Chaos of Black Tuesday
Everything came to a head in late October 1929. The Great Crash started with a gut-wrenching drop on Black Monday, October 28, when the Dow Jones Industrial Average (DJIA) fell nearly 13%. But the real panic hit the next day. On Black Tuesday, October 29, the market plunged almost another 12%.
In just two days, the market imploded, wiping out fortunes overnight. The Dow, which had hit a peak of 381 just a month before, eventually scraped bottom at 41.22 in 1932—a mind-boggling 89% loss of value. You can find more details about this historic collapse on Wikipedia's comprehensive overview.
The human cost was instant and brutal. People gathered on the streets outside the New York Stock Exchange, watching in stunned silence as their life savings disappeared. The dream of easy wealth was dead.
From Market Crash to Global Depression
The 1929 crash wasn’t a one-off event. It was the spark that ignited the Great Depression, the worst economic catastrophe of the modern era. The fallout spread like a virus:
- Bank Failures: Banks had loaned money to speculators or invested their customers' savings in the market. When the market crashed, the banks went under, taking with them the savings of people who never even owned a single stock.
- Consumer Spending Halts: With fortunes gone and fear in the air, people stopped buying anything but the absolute necessities.
- Massive Unemployment: As demand dried up, businesses had no choice but to lay off workers. By 1933, unemployment in the United States had skyrocketed to nearly 25%.
The pain spread across the globe, kicking off a decade of hardship. This chapter in the history of stock market crashes exposed the massive flaws in an unregulated financial system. It was painfully clear that without guardrails, markets were prone to wild speculation and devastating collapses.
In response, the U.S. government passed historic laws to restore trust and prevent another meltdown. This led to the creation of the Securities and Exchange Commission (SEC) in 1934, an agency whose job is to protect investors and keep markets fair. The hard lessons of 1929 changed financial regulation forever.
Modern Meltdowns: Black Monday and The Dot-Com Bust

As the 20th century wound down, technology began to reshape the financial world, bringing with it entirely new kinds of risk. Two events perfectly capture this shift: the machine-driven panic of Black Monday and the speculative frenzy of the Dot-Com bust. These weren't your grandfather's market crashes; they were modern meltdowns that proved progress could also introduce unforeseen dangers.
One crash was triggered by algorithms moving faster than any human could react. The other was fueled by a captivating story about the future that completely overshadowed present-day reality. Both served as stark reminders that while the tools of trading change, the underlying human emotions of fear and greed are timeless.
Black Monday, 1987: A Digital Domino Effect
On October 19, 1987, the market did something it had never done before—it crashed with the help of computers. On what became known as Black Monday, the Dow Jones Industrial Average plunged an astonishing 22.6% in a single day. To this day, it remains the largest one-day percentage drop in the Dow's history.
The strange part? There was no obvious economic catastrophe to blame. The crash seemed to materialize out of thin air, abruptly ending a five-year bull run. The culprit turned out to be a newfangled strategy called portfolio insurance.
This was an automated hedging technique where computer programs were set to automatically sell stocks if the market fell by a certain amount. The idea was to limit losses for big institutional investors. In theory, it sounded smart. In practice, it was a disaster waiting to happen.
When the market started to dip that Monday, the programs kicked in and started selling. But as those sales pushed prices lower, they triggered more automated sell orders, which pushed prices down even further.
It was a digital domino effect. The very tool designed to protect portfolios created a vicious feedback loop of panic, overwhelming the market and proving that technology could pour gasoline on a fire.
What made Black Monday so terrifying was its sheer speed. Unlike the slow-motion collapse of 1929, this was a brutal, instantaneous shock. It was a critical lesson: no matter how sophisticated your financial models are, they can have dangerous, unintended consequences when everyone rushes for the same exit at once.
The Dot-Com Bubble Bursts
Just over a decade later, another kind of mania gripped the markets, this time built on the promise of the internet. The late 1990s gave us the Dot-Com Bubble, a period of wild speculation in internet-based companies. Investors, swept up in the excitement, threw money at any startup with a ".com" in its name.
This wasn't about profits or even revenue; it was about hype and a collective fear of missing out on the "next big thing." Companies with no viable business model—and often no earnings at all—were suddenly worth billions overnight. The common thinking was that old-school valuation metrics just didn't apply to this new digital economy.
This "irrational exuberance," as then-Fed Chairman Alan Greenspan famously called it, inflated a massive bubble. The tech-heavy NASDAQ Composite index, which was under 1,000 in 1995, rocketed to over 5,000 by March 2000.
But the party had to end. The reckoning began in early 2000 as interest rates started to climb and some major tech players quietly began to cash out. Confidence evaporated, panic selling took over, and the bubble popped with spectacular force.
The fallout from the Dot-Com bust was immense:
- Massive Value Destruction: By late 2002, the NASDAQ had cratered by nearly 78% from its peak. Trillions of dollars in market value simply vanished.
- Widespread Business Failures: Hundreds of dot-com companies, suddenly cut off from investor cash, went bankrupt. Companies like Pets.com and Webvan became poster children for the era's excess.
- A Return to Fundamentals: The crash taught a new generation a painful but vital lesson: a great idea isn't the same as a great business. Ultimately, things like profitability and cash flow actually matter.
The Dot-Com bust was a classic chapter in the history of stock market crashes. It showed how a compelling story can cause investors to suspend disbelief, but it also served as a firm reminder that the basic principles of value can't be ignored forever.
The 2008 Global Financial Crisis Explained
Of all the modern history of stock market crashes, the 2008 Global Financial Crisis was a different beast entirely. This wasn't just another bad day for stocks or a single industry taking a hit. It was the near-meltdown of the entire global financial system, sparked by something that seemed worlds away from Wall Street: the U.S. housing market.
Think of it like building a massive, gleaming skyscraper on a foundation of sand. For years, the tower climbs higher, looking stronger than ever. But underneath it all, the foundation is quietly eroding, ready to give way at the slightest tremor. That's the perfect picture of what happened in 2008.
A Skyscraper Built on Sand
The "skyscraper" was our interconnected global financial system. The "sandy foundation" was the U.S. housing market, which had ballooned into a huge bubble fueled by risky subprime mortgages.
These were home loans handed out to borrowers with shaky credit who wouldn't typically qualify. Lenders pushed these loans aggressively, working under the assumption that since home prices always go up, they were safe from defaults.
Then, Wall Street's financial engineers got involved. They bundled thousands of these dicey mortgages into complex investment products called mortgage-backed securities (MBS) and collateralized debt obligations (CDOs). These were then sliced up and sold to pension funds, insurance companies, and banks all over the world. The big problem? Almost no one understood the toxic risk lurking inside these incredibly complicated packages.
The fatal flaw was the deeply held belief that U.S. home prices would never fall on a national scale. This single assumption allowed a mountain of high-risk debt, disguised as safe investments, to infect the entire global financial system.
When the housing bubble finally popped and home prices started to drop, that sandy foundation crumbled.
The Dominoes Start to Fall
The tremor hit when interest rates on all those adjustable-rate mortgages began to reset higher. Suddenly, homeowners couldn't keep up, and they started defaulting on their loans in record numbers.
This set off a catastrophic chain reaction that brought the whole skyscraper down:
- Mortgage-Backed Securities Implode: The MBS and CDO products, once rated as safe as government bonds, became worthless almost overnight. The institutions holding them were staring at unthinkable losses.
- Banks Face Insolvency: Major global banks woke up to find their balance sheets filled with billions in toxic assets. Trust vanished. Banks slammed the brakes on lending to each other, and the credit markets—the lifeblood of the economy—froze solid.
- Lehman Brothers Fails: The crisis hit a terrifying peak on September 15, 2008. The investment bank Lehman Brothers, fatally exposed to the subprime mess, declared bankruptcy. The news sent a shockwave of pure panic across the globe.
The collapse of Lehman proved that no institution was too big to fail—or so everyone thought. The ensuing panic triggered one of the most severe stock market crashes since the Great Depression. The Dow Jones Industrial Average (DJIA) plunged 51.1% from its 2007 peak to its 2009 low, while the S&P 500 fared even worse, dropping by 56.8%. You can explore more data on how major events have affected the stock market over the last 100 years.
The Bailout and Regulatory Overhaul
With the financial system teetering on the edge of total disintegration, the U.S. government was forced to step in. Congress passed the Troubled Asset Relief Program (TARP), a $700 billion bailout fund used to buy up toxic assets from banks and inject capital to stop the bleeding.
At the same time, central banks worldwide, led by the U.S. Federal Reserve, slashed interest rates to near zero and unleashed massive stimulus programs to get money moving again.
The crisis forced a complete rethinking of financial regulation. The aftermath gave us the Dodd-Frank Wall Street Reform and Consumer Protection Act in 2010. This was sweeping legislation designed to prevent a repeat performance by making the system more transparent, holding banks accountable, and creating new oversight bodies like the Consumer Financial Protection Bureau (CFPB). More than anything, 2008 was a painful lesson in systemic risk—a brutal reminder of how a problem in one corner of the market can threaten the entire global economy.
Comparing Major Crashes Throughout History
If you look at the history of stock market crashes, it's a bit like studying a century's worth of powerful storms. Each one had its own unique trigger and timeline, but they were all born from similar atmospheric conditions: human behavior and financial vulnerability. When we put them side-by-side, the patterns that investors need to understand become crystal clear.
A common thread runs from the Roaring Twenties to the dawn of the new millennium: speculative excess. In 1929, it was everyday folks buying stocks on margin—essentially, with borrowed money. Fast forward to 2000, and you had venture capitalists pouring billions into dot-com startups with no clear path to profit. Then in 2008, it was a massive housing bubble inflated by the dangerous belief that real estate prices only go up.
In every case, a compelling story completely overshadowed fundamental value.
Human Behavior and Technological Accelerants
Another fascinating parallel is how new technology can introduce risks no one saw coming. While innovation is often the engine of economic growth, it can also pour gasoline on the fire when panic takes hold.
- The Great Crash (1929): The ticker tape and telephone gave investors real-time access to market information for the first time. Unfortunately, that also meant fear could spread faster than ever before.
- Black Monday (1987): Computerized "portfolio insurance" programs were designed to limit risk. Instead, they created a digital domino effect, triggering waves of automated selling that spiraled out of control.
- Global Financial Crisis (2008): Incredibly complex financial products, like mortgage-backed securities, were so opaque they effectively hid toxic risk from sight. When they finally imploded, the collapse blindsided the entire global banking system.
The image below really drives home the sheer scale of the 2008 crisis, detailing the market’s plunge, the subsequent bank failures, and the massive government intervention needed to stop the bleeding.
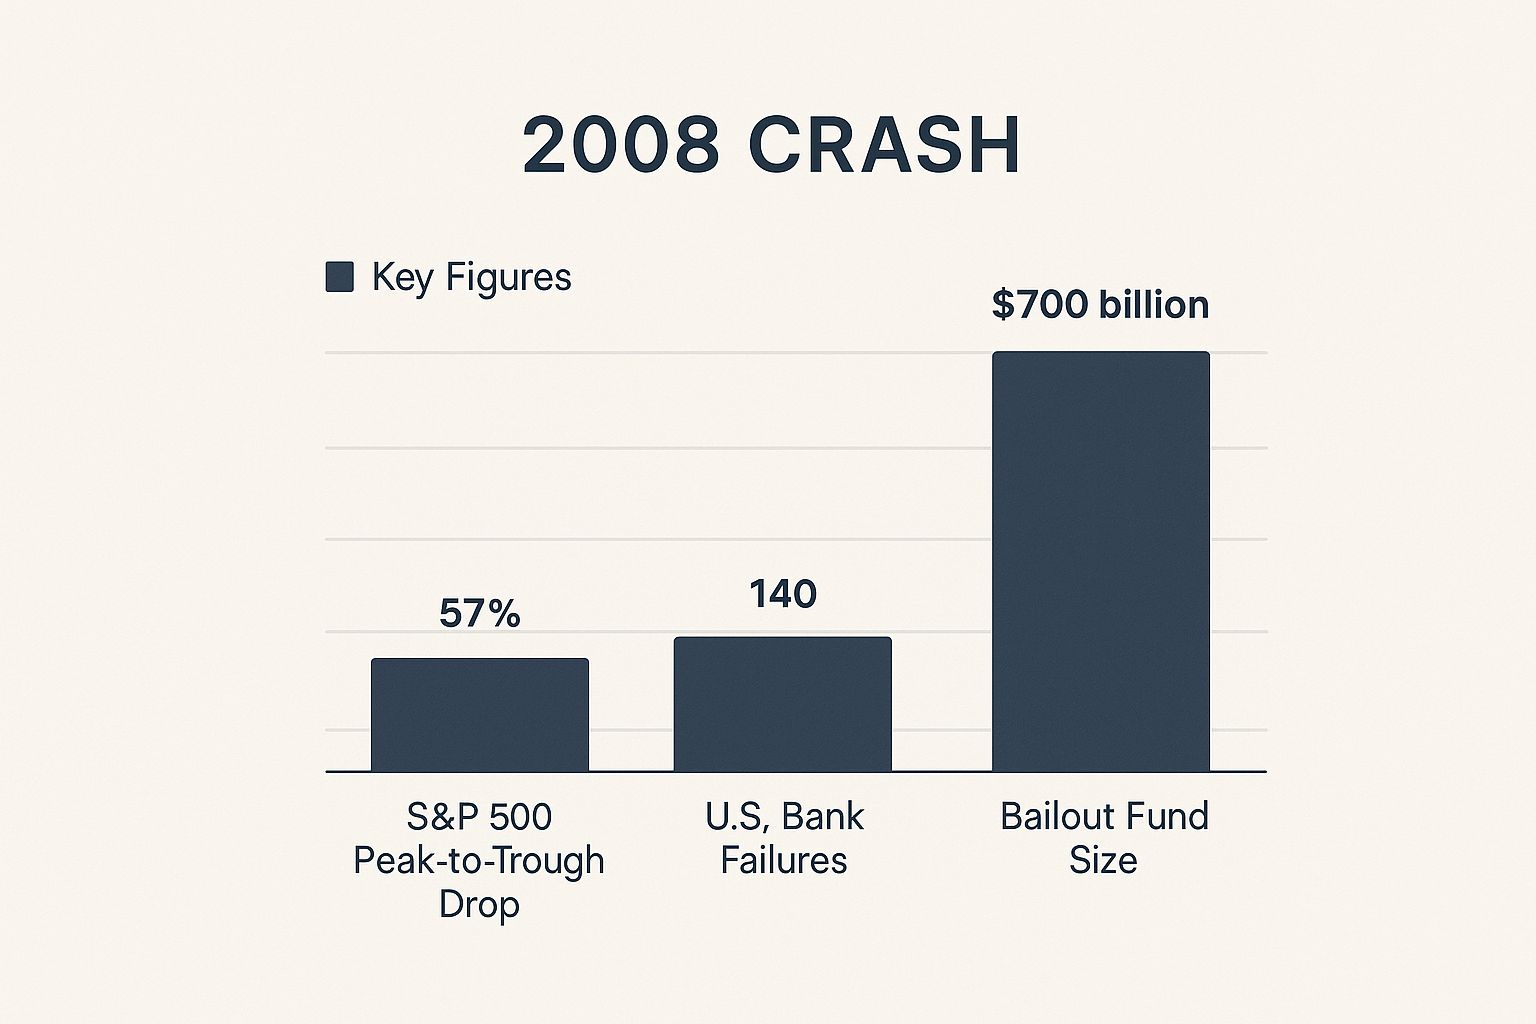
This data vividly shows how a problem in the housing market cascaded into a full-blown systemic failure. It led to a market drop of over 50% and required a $700 billion bailout just to keep the financial world from collapsing entirely.
A Comparative Snapshot of Historic Crashes
To really connect the dots, let's put these major crashes into a simple comparison table. This format helps reveal how very different catalysts—from automated trading to bad mortgages—can lead to surprisingly similar outcomes, whether it's a sudden shock or a long, grinding downturn.
Comparison of Major 20th and 21st Century Market Crashes
Each crash teaches a slightly different lesson, but they all point to one timeless truth: markets move in cycles. Periods of extreme optimism often plant the seeds for the next downturn.
Of course, understanding these historical parallels isn't about perfectly predicting the future. It's about learning to recognize the warning signs and developing a deep respect for the timeless principles of risk, value, and human psychology that continue to drive the market.
Timeless Investing Lessons from Market History

Looking back at the history of stock market crashes isn't just an academic exercise. Think of it as a practical playbook for building a tougher, more resilient investment strategy. Every meltdown, from the Great Depression in 1929 to the Financial Crisis of 2008, offers powerful lessons that are just as relevant today.
While no one has a crystal ball to predict the next downturn, you can absolutely prepare for its inevitability.
Perhaps the biggest takeaway is the sheer danger of making decisions based on emotion. When the market is in a freefall and every headline is screaming panic, the gut reaction is to sell everything and stop the bleeding. But history shows, time and again, that investors who panic-sell often just lock in their losses, missing out on the eventual recovery that follows.
The Power of Diversification and Patience
One of the most vital lessons hammered home by past meltdowns is the old wisdom of not putting all your eggs in one basket. Diversification is your best defense, spreading risk to cushion your wealth against major hits during volatile periods. When one part of the market gets crushed, others might hold steady or even climb, softening the blow.
And this isn't just about owning a few different stocks. Real diversification means spreading your investments across various asset classes, industries, and even different parts of the world.
A Timeless Truth: The stock market has recovered from every single crash in its history. While past performance is no guarantee of future results, this historical pattern underscores the immense value of patience and keeping your eyes on the long-term prize.
Avoiding Common Investor Traps
The recurring themes in market history also shine a light on several traps that investors fall into over and over. Just recognizing them is the first step to sidestepping them yourself.
- Trying to Time the Market: Guessing the market's absolute peak to sell and its rock bottom to buy is a fool's errand. Far more often than not, this leads to buying high and selling low—the exact opposite of what you want to do.
- Following the Herd: The fear of missing out (FOMO) during a bubble and the panicked rush for the exits during a crash are two sides of the same coin. The most successful investors often make their best moves by going against the crowd.
- Forgetting Fundamentals: In every speculative frenzy, investors convince themselves that "this time is different." They toss aside proven valuation metrics for pure hype, a mistake that has proven incredibly costly, time and again.
At the end of the day, the goal isn't to avoid downturns altogether—they're a natural and unavoidable part of the market cycle. The real objective is to build a solid financial plan that can weather the storm. By embracing diversification, keeping emotions in check, and staying focused on your long-term goals, you can navigate future volatility with confidence, knowing that crashes are temporary setbacks, not permanent defeats.
A Few Common Questions
Diving into the history of stock market crashes always brings up a few key questions. Let’s tackle some of the most common ones to help put these major market events into perspective.
What's the Difference Between a Crash and a Correction?
While people sometimes use these terms interchangeably, they describe very different situations. The real difference comes down to speed and severity.
- A market correction is when the market drops between 10% and 20% from a recent high. These are fairly normal, happening every year or two on average. They're uncomfortable, but the market usually bounces back within a few months.
- A stock market crash is a different beast entirely. It’s a steep, sudden dive of 20% or more, often happening in just a few days. Crashes are driven by intense, widespread panic. They're much rarer than corrections but pack a far bigger economic punch.
Can Anyone Actually Predict the Next Crash?
In a word: no. It's impossible for anyone to consistently and accurately predict the exact timing of the next stock market crash. Analysts can spot warning signs—like speculative bubbles or weak spots in the economy—but the final trigger that causes panic to set in is always a wild card.
The best strategy isn’t trying to time the market, but preparing your portfolio for the downturns that will inevitably come. Building a resilient financial plan is a much more reliable approach than trying to guess the market’s next move.
How Long Does It Take for the Market to Recover?
Recovery times are all over the map, depending entirely on what caused the crash and how deep the damage was.
After Black Monday in 1987, the market clawed back its losses in about two years. But following the Great Crash of 1929, it took a full 25 years for the market to climb back to its previous peak.
The most important takeaway here is that markets have always recovered, from every single crash in history. Patience is an investor's best friend. Understanding how to build a portfolio for the long haul is what gets you through these periods. For anyone looking for help with that long-term strategy, exploring the benefits of investing with a financial advisor can offer both a disciplined approach and valuable peace of mind.
At Commons Capital, we help clients build robust financial strategies designed to weather market volatility and achieve long-term goals. If you're looking to secure your financial future, visit https://www.commonsllc.com to learn how our expertise can benefit you.